
Tracking four key metrics can help practices identify the root causes of their access problems while addressing physician overload.
Fam Pract Manag. 2023;30(6):37-41
Author disclosures: no relevant financial relationships.

Easy access to a usual source of primary care is key to a well-functioning health care system, yet an increasing number of patients report that they do not have a usual source of primary care.1 Long wait times for appointments, evolving patient expectations, and ongoing practice staffing shortages may all be responsible.
How well is your practice keeping up with patient demand? Other than formal complaints or patients lost to follow-up, how do you know if your appointment availability is adequate? If you suspect your practice has an access problem, perhaps due to a physician staffing shortage, how should you go about solving it? A practice dashboard can help physicians and administrators answer these questions.
Prior articles have described key steps to improve access, including how to assign and adjust panel sizes,2–4 carve out same-day appointments,5 implement open-access scheduling,6 and schedule patients more efficiently.7 This article presents a simple dashboard that can help you track barriers to access and make data-driven decisions for practice improvement,8 and it applies the dashboard to three primary care practice scenarios.
Improving patient access is key to improving the patient experience. But improving the patient experience is not the only goal. The physician experience is also important. Clinicians today face burnout at epic proportions, and primary care practices are at great risk of additional workforce loss through “the great resignation.”9 Ensuring appropriate clinician staffing is critical to serving patients and reducing burnout. Of course, not every clinic problem can or should be solved by more spending and more staffing. Practice administrators and physician leaders must analyze the pressures on workflows and properly diagnose operational issues before initiating solutions. Tracking key metrics via a practice dashboard can help teams get to the root causes of their access problems while addressing physician overload.
KEY POINTS
A dashboard with four key metrics can help practices identify and solve problems related to patient access and clinician staffing.
Improving access not only benefits patients but also helps physicians, who may be overloaded and at risk of burnout.
Setting shared goals for the four metrics and depicting performance ranges as a stoplight grid allows for quick assessment of how the practice is doing.
DASHBOARD COMPONENTS
A basic dashboard for assessing supply and demand contains four metrics — staffing rate, fill rate, time to third next available appointment, and no-show rate — along with the practice's goals for each metric and a “stoplight grid” for quickly assessing performance.
Staffing rate. This measure helps you evaluate your staffing needs by comparing your actual staffing with your desired staffing. For the purposes of this article, “staffing” refers to clinicians — members of the clinical team who operate on an appointment-based clinical schedule. To make a reasonably accurate determination of both the actual and the desired number of clinical hours across the practice per day, multiply the number of appointments per day by the number of minutes per appointment, and then multiply that sum by the number of clinicians seeing patients that day. The actual clinical hours should reflect what actually occurred each day, while the desired clinical hours should reflect what would have been ideal each day. (See “Desired clinical hours.”) Divide the actual number of clinical hours by the desired number of clinical hours to calculate your staff rate — e.g., 75%. (See “How to calculate the four metrics.”)
Based on your patient panel's needs, estimate the ideal number of clinical hours for each day. This informs the staffing rate in the dashboard and can inform your scheduling going forward.
| Mon | Tues | Wed | Thurs | Fri | Sat | Sun | |
|---|---|---|---|---|---|---|---|
| Number of desired appointments per full-time clinician | 20 | 20 | 20 | 20 | 20 | 10 | 0 |
| Number of minutes per appointment | 20 min. | 20 min. | 20 min. | 20 min. | 20 min. | 20 min. | 0 |
| Number of desired clinicians scheduled | 5 | 4 | 4.5 | 3 | 5 | 1 | 0 |
| Total minutes | 2,000 | 1,600 | 1,800 | 1,200 | 2,000 | 200 | 0 |
| Total desired clinical hours | 33.33 | 26.67 | 30 | 20 | 33.33 | 3.33 | 0 |
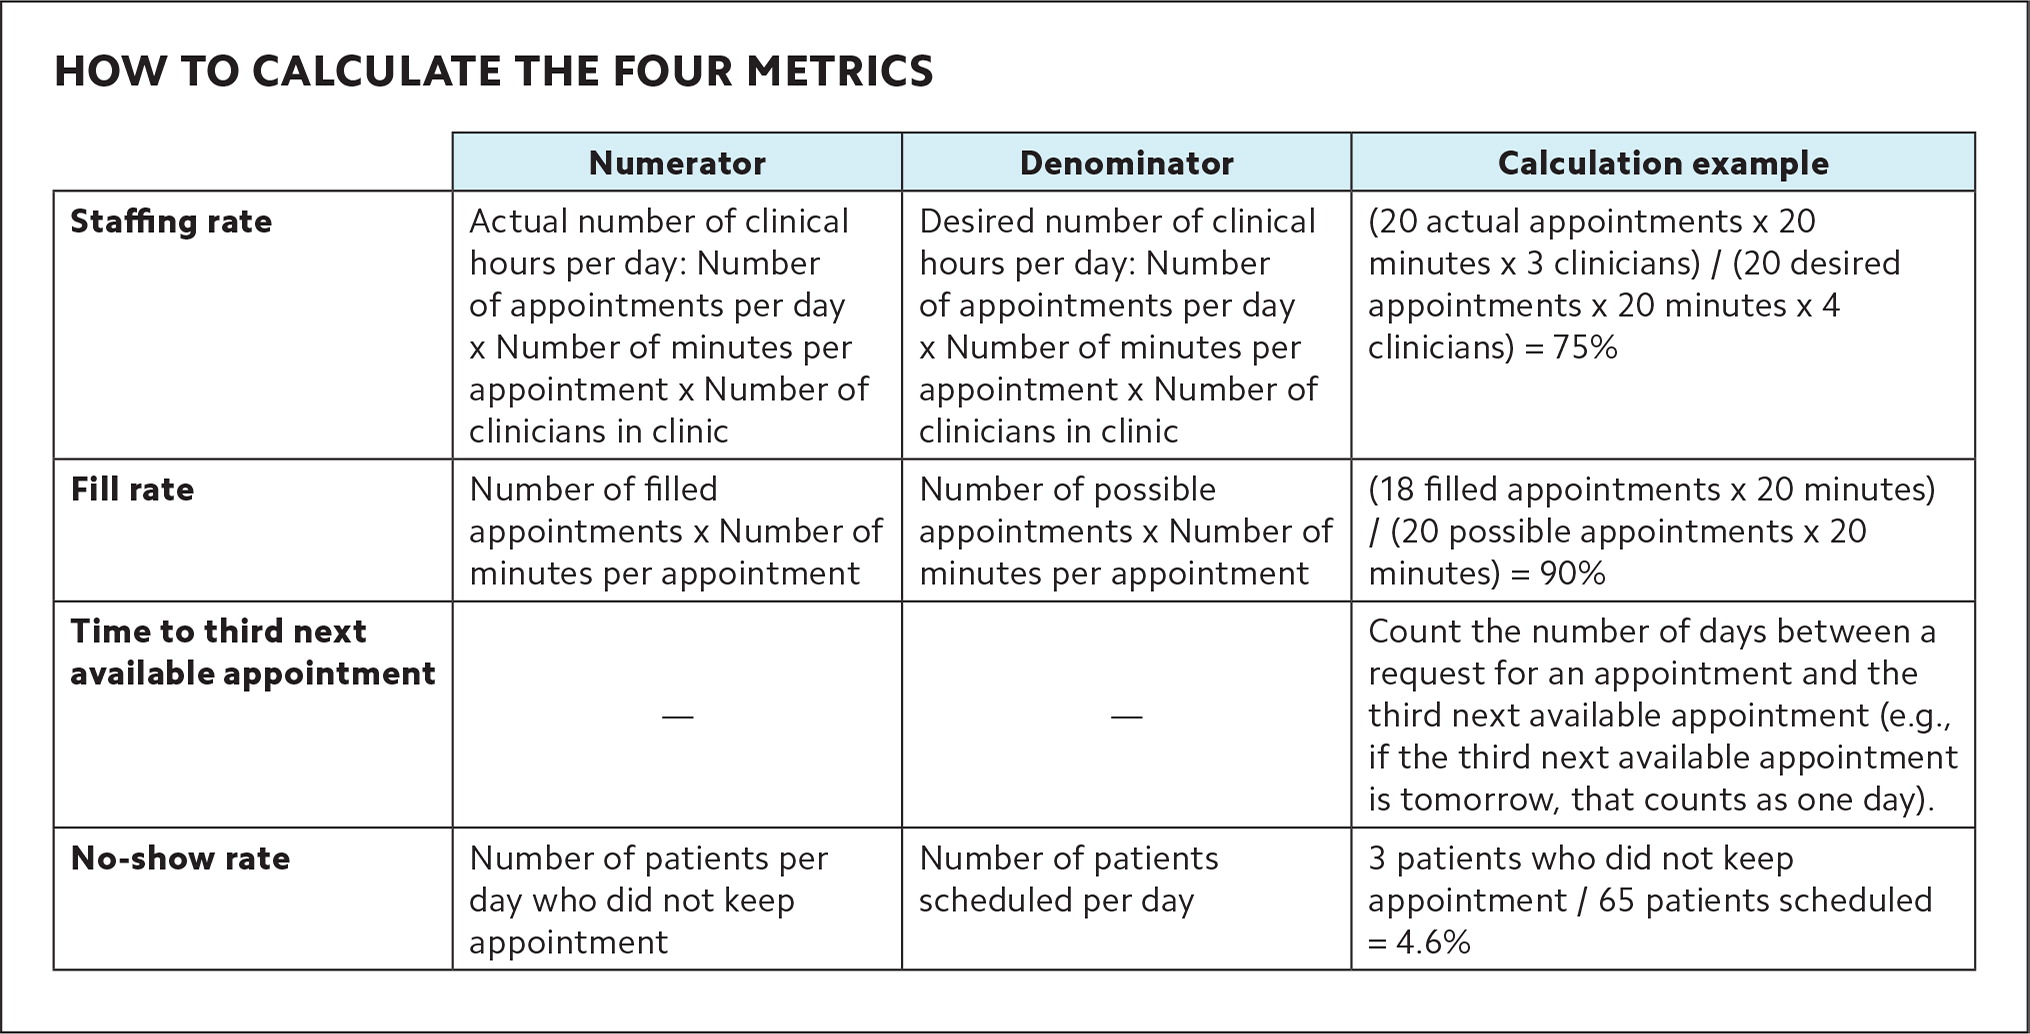
HOW TO CALCULATE THE FOUR METRICS
| Numerator | Denominator | Calculation example | |
|---|---|---|---|
| Staffing rate | Actual number of clinical hours per day: Number of appointments per day x Number of minutes per appointment x Number of clinicians in clinic | Desired number of clinical hours per day: Number of appointments per day x Number of minutes per appointment x Number of clinicians in clinic | (20 actual appointments x 20 minutes x 3 clinicians) / (20 desired appointments x 20 minutes x 4 clinicians) = 75% |
| Fill rate | Number of filled appointments x Number of minutes per appointment | Number of possible appointments x Number of minutes per appointment | (18 filled appointments x 20 minutes) / (20 possible appointments x 20 minutes) = 90% |
| Time to third next available appointment | — | — | Count the number of days between a request for an appointment and the third next available appointment (e.g., if the third next available appointment is tomorrow, that counts as one day). |
| No-show rate | Number of patients per day who did not keep appointment | Number of patients scheduled per day | 3 patients who did not keep appointment / 65 patients scheduled = 4.6% |
Staffing rates should be delineated for each day of the week, as the ebb and flow of outpatient practice may cause some days to be busier than others, but you can average them together for purposes of the dashboard. Some practices may elect to break down staffing rates by half-days or differentiate between weekend or evening hours based on the type of practice or patient population. For example, a college health clinic may desire more appointment availability in the afternoons, evenings, or weekends, whereas a community practice may desire more appointment availability in the early morning hours.
Fill rate. To calculate the fill rate, divide the number of filled appointments (i.e., the total patients seen that day, not including no-shows but including walk-ins) by the number of possible appointments in the clinical schedule while accounting for the number of minutes per appointment if there are differences in the schedule. In our experience, the fill rate for a practice should be 90%–95%, which allows the practice to be busy but accounts for last-minute shifts in demand (e.g., an infectious disease outbreak).
Time to third next available appointment. Practices can measure accessibility by a standardized metric such as the time, in hours or days, until the third next available appointment.10 The times to the first and second next available appointment are less reliable because they're more sensitive to last-minute cancellations or no-shows.9 As a result, the time to third next available appointment has become a commonly accepted metric and is often included in electronic health record (EHR) practice management packages. Practices may elect to calculate this metric separately for each appointment type (e.g., urgent, same-day, routine, and preventive appointments).
No-show rate. This measures the percentage of patients who were scheduled but did not show up for their appointments on a given day. In our experience, the no-show rate should be no more than 5%. Most practice management systems can quickly calculate it.
Goals. Once a practice obtains the four basic measures, the next step is to gather a team of multidisciplinary stakeholders to decide on shared goals for the dashboard, which can be tweaked based on practice needs. (See “Practice dashboard: goals and stoplight grid.”) For example, a practice that sees a high volume of urgent visits (e.g., because of a large pediatric or adolescent population) may need a shorter time to third next available appointment for same-day visits. Similarly, a community-based practice may be satisfied with a seven-day wait for routine visits, while another practice may want to improve accessibility for routine appointments to four days, based on needs of the population it serves. Once practices decide on these goals, they can display them within the practice and disseminate them to all team members and stakeholders, including patients. Operating with shared goals helps team members understand and meet expectations and is critical to ensuring patients are satisfied with access.
Stoplight grid. Once you have agreed on the goals for each metric, construct a “stoplight grid” (see “Practice dashboard: goals and stoplight grid”) in which green represents optimal performance, yellow depicts a warning zone, and red signals that an urgent change in operations is needed. This can be a helpful strategy for quickly understanding and communicating how well the practice is performing.
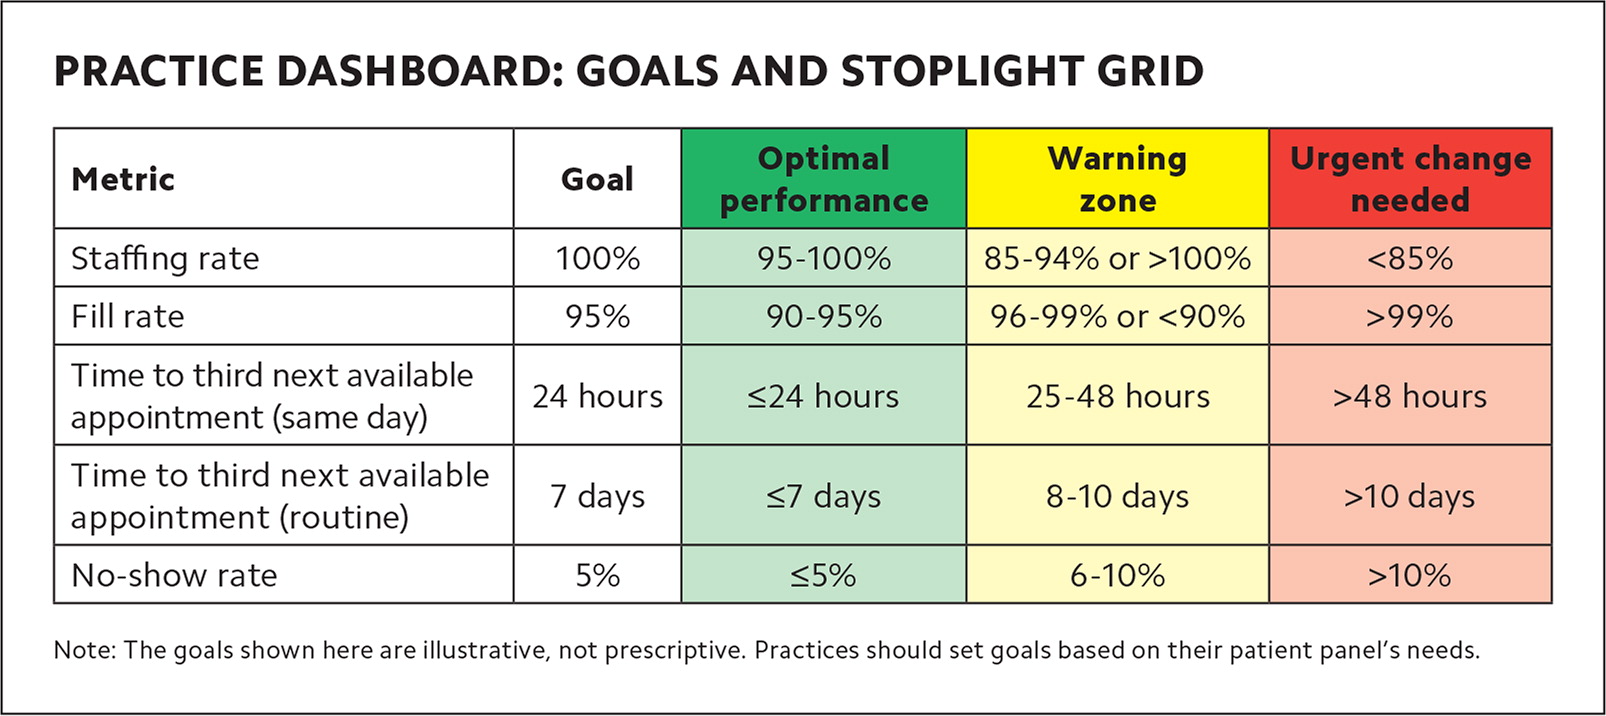
PRACTICE DASHBOARD: GOALS AND STOPLIGHT GRID
| Metric | Goal | Optimal performance | Warning zone | Urgent change needed |
|---|---|---|---|---|
| Staffing rate | 100% | 95–100% | 85–94% or >100% | <85% |
| Fill rate | 95% | 90–95% | 96–99% or <90% | >99% |
| Time to third next available appointment (same day) | 24 hours | ≤24 hours | 25–48 hours | >48 hours |
| Time to third next available appointment (routine) | 7 days | ≤7 days | 8–10 days | >10 days |
| No-show rate | 5% | ≤5% | 6–10% | >10% |
USING THE DASHBOARD: THREE CASES
A weekly meeting with operational practice leadership provides a standard time and place to review the dashboard and adjust scheduling based on the data. It can also be helpful to debrief after particularly busy days and to monitor trends in each metric (or a combination of metrics) to determine root causes of common practice management problems.
The following scenarios describe common challenges in a variety of outpatient settings and show how practices can use the dashboard to identify sources of discord and quickly develop solutions.
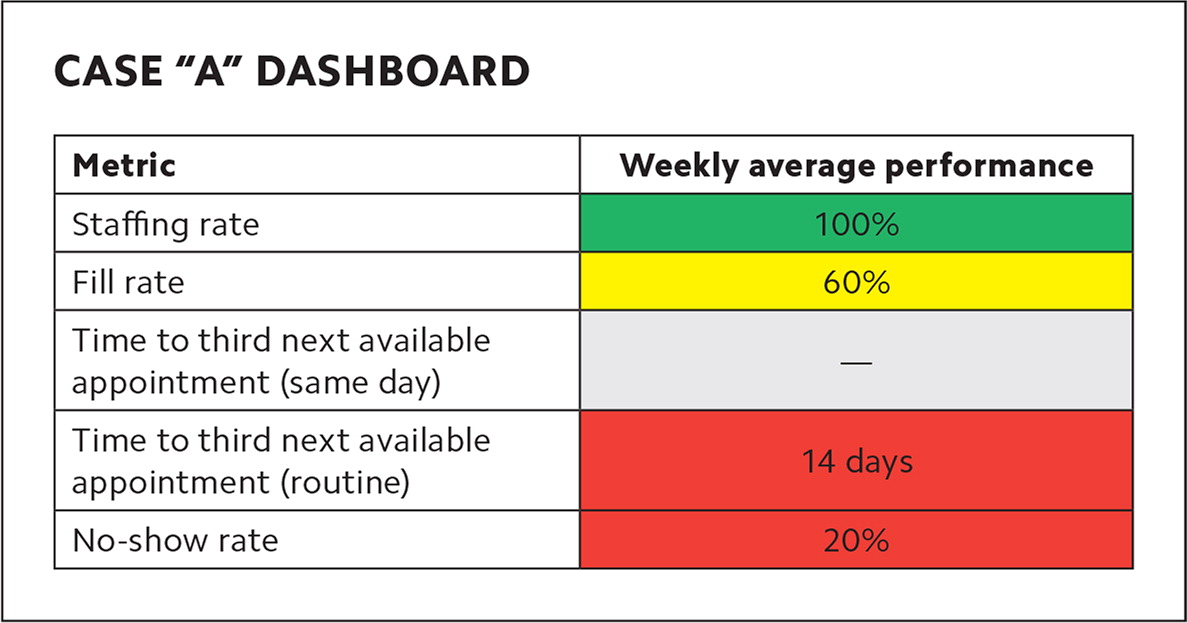
Case A: A six-physician family medicine practice has been running slowly lately, and the practice team cannot figure out why. Revenue is starting to dip, and there are concerns about staying afloat financially. Let's take a look at their dashboard. Note that this practice does not differentiate between same-day and routine appointments and, therefore, does not calculate a third next available appointment metric for same-day appointments.
Assessment: This practice has dedicated physicians who are showing up to work and seeing patients, but there is an illusion of decreased access. A high time to third next available appointment would normally indicate the practice is too busy, but the high no-show rate and low fill rate indicate the practice is losing out on productivity and revenue opportunities from patients who don't come in for their appointments. The practice would benefit from open-access scheduling, differentiating between same-day and routine appointments, and allowing patients to make appointments closer to when they are needed.
| Metric | Weekly average performance |
|---|---|
| Staffing rate | 100% |
| Fill rate | 60% |
| Time to third next available appointment (same day) | — |
| Time to third next available appointment (routine) | 14 days |
| No-show rate | 20% |
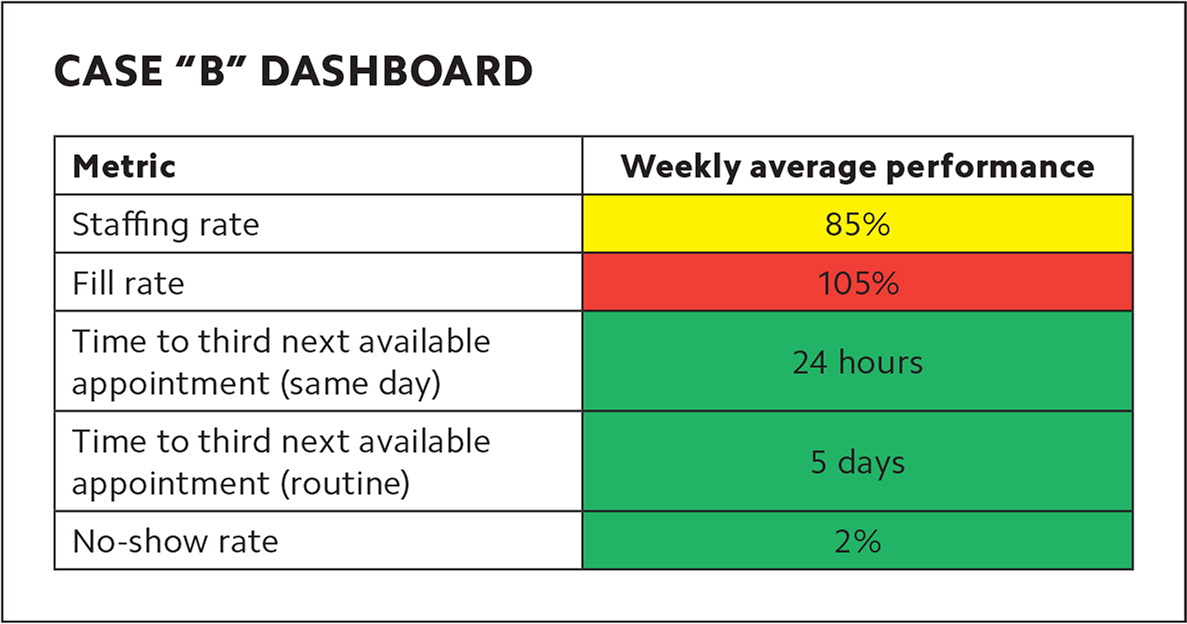
Case B: A busy college health clinic employs 20 clinicians who are expressing high levels of burnout. Clinic leaders are wondering if the workload is too heavy. (See dashboard B.)
Assessment: This practice has extremely high throughput, with access at a reasonable level as evidenced by a low time to third next available appointment and a low no-show rate. However, there is evidence of double-booking, with a fill rate of more than 100% and a staffing rate below 100%. This clinic needs more clinicians.
| Metric | Weekly average performance |
|---|---|
| Staffing rate | 85% |
| Fill rate | 105% |
| Time to third next available appointment (same day) | 24 hours |
| Time to third next available appointment (routine) | 5 days |
| No-show rate | 2% |
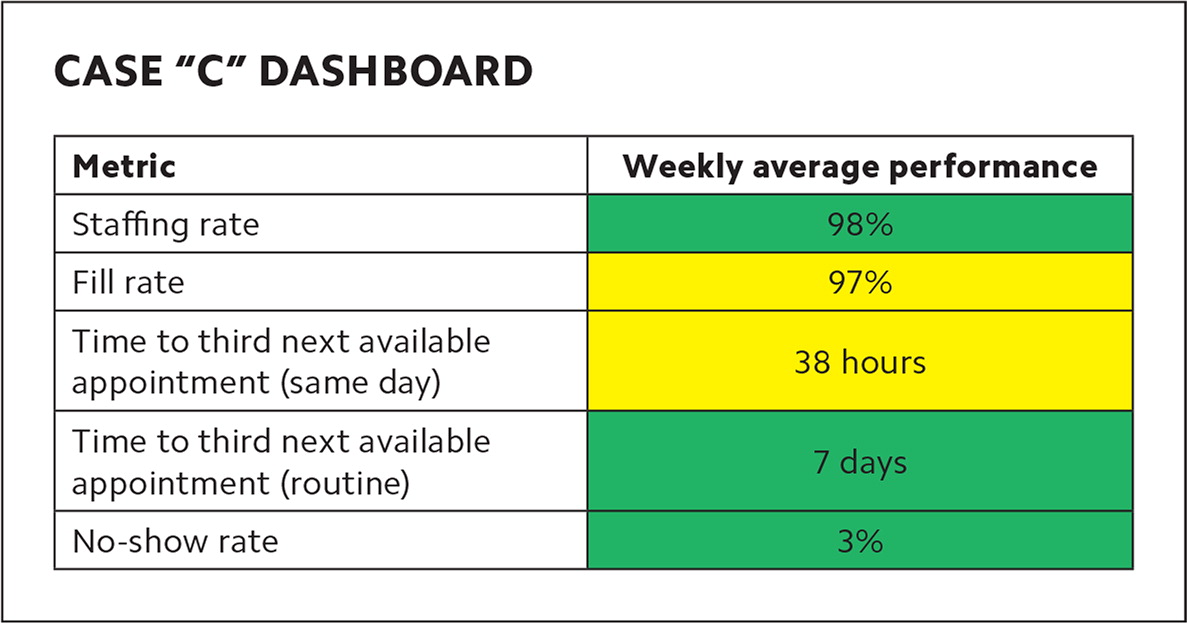
Case C: A federally qualified health center employs nine physicians and is considering hiring more clinicians but isn't sure if the current visit volume warrants an additional expenditure. (See dashboard C.)
Assessment: This practice is close to functioning optimally, but a small increase in demand could max out the fill rate or extend the time to third next available appointment, which could tip the staff into burnout. This practice could consider adjusting clinicians' patient panels or investing in per diem time, and then observe whether metrics balance out or warrant adding a full- or part-time clinician.
| Metric | Weekly average performance |
|---|---|
| Staffing rate | 98% |
| Fill rate | 97% |
| Time to third next available appointment (same day) | 38 hours |
| Time to third next available appointment (routine) | 7 days |
| No-show rate | 3% |
IMPROVING PATIENT AND CLINICIAN SATISFACTION
Physicians and health care leaders across practice settings are too often asked to do more with less. While physician shortages loom large and require solutions to put more clinicians into practice, improving operational performance at the practice level can also improve physician satisfaction. When clinicians observe the system facilitating inefficiency and not supporting patient access, it increases frustration and burnout. Patients are also increasingly attentive to office efficiency and make choices about where they get care based on the whole practice, not just the individual clinician. Creating a dashboard can help with both diagnosis and treatment of these issues in a family medicine practice.
